
Running a restaurant on gut feeling alone is a losing game. You might sense that Saturday nights are busy or that the butter chicken sells well, but "busy" doesn't pay rent and "sells well" doesn't tell you if it's actually profitable. The restaurants that survive — and scale — in India's brutally competitive food service market are the ones that track the right numbers, consistently, and act on them.
That's where Key Performance Indicators, or restaurant KPI metrics, come in. These are the specific, measurable numbers that tell you whether your restaurant is healthy, where money is leaking, and what's actually driving your growth. In this guide, we break down the KPIs every restaurant owner, manager, and operator in India should be watching in 2026 — and how the right restaurant management software turns this from a spreadsheet chore into a real-time dashboard.
What Are Restaurant KPI Metrics?
Restaurant KPI (Key Performance Indicator) metrics are measurable values that help restaurant owners evaluate operational efficiency, financial performance, customer satisfaction, and overall business growth. Instead of relying on assumptions, KPIs provide real-time data that supports informed decision-making.
Restaurant KPI metrics cover every aspect of restaurant management—from food cost and labor expenses to table turnover, kitchen efficiency, customer retention, and sales performance. Monitoring these metrics regularly enables restaurant owners to identify problems early, improve profitability, and deliver a better customer experience.
Whether you operate a café, cloud kitchen, fine-dining restaurant, QSR, bakery, or multi-outlet chain, tracking the right KPIs is essential for sustainable growth.
Why Restaurant KPIs Matter More Than Ever in 2026
Indian restaurants today operate on wafer-thin margins — typically between 6% and 12% net profit — while facing rising rentals, ingredient inflation, platform commissions from Swiggy and Zomato, and increasing customer expectations around speed and quality. In this environment, intuition-based decision-making is expensive.
Data-backed operations, on the other hand, let you:
Spot problems (rising food cost, slow table turnover, high staff turnover) before they become crises
Make pricing and menu decisions based on actual profitability, not assumptions
Benchmark performance across multiple outlets or franchise locations
Justify investment decisions — new equipment, additional staff, marketing spend — with numbers
Respond faster to seasonal and demand shifts, especially around festivals and weekends
The restaurants winning right now aren't necessarily the ones with the best food. They're the ones that know their numbers are cold.
Benefits of Tracking Restaurant KPI Metrics
Tracking restaurant KPI metrics helps owners and managers understand business performance, reduce costs, and make smarter decisions. With accurate data, restaurants can improve daily operations, increase profits, and deliver better customer experiences.
1. Better Profitability
Monitoring KPIs like sales revenue, food cost percentage, and profit margins helps identify unnecessary expenses and optimize spending. Restaurants can control costs and improve overall profitability.
2. Lower Food Waste
Inventory and food cost tracking help restaurants monitor ingredient usage, prevent overstocking, and reduce expired or wasted items, leading to better resource management.
3. Faster Decision-Making
Real-time data provides valuable insights into sales trends, customer preferences, and operational issues, helping managers make quick and informed decisions.
4. Improved Staff Productivity
Tracking employee performance, order processing time, and shift efficiency helps optimize workforce management and improve team productivity.
5. Better Customer Experience
KPIs such as waiting time, order accuracy, and customer feedback help restaurants identify service gaps and improve guest satisfaction.
6. Data-Driven Menu Engineering
Analyzing item performance helps restaurants identify best-selling and high-profit dishes, optimize menus, and make smarter pricing decisions.
7. Higher Operational Efficiency
Monitoring kitchen speed, billing time, inventory movement, and workflow helps eliminate bottlenecks and create smoother operations.
8. Easier Multi-Outlet Management
Centralized KPI tracking allows restaurant owners to compare branch performance, monitor sales, and maintain consistency across multiple locations.
By tracking the right restaurant KPIs, businesses can reduce costs, improve efficiency, and build a more profitable and scalable operation.
Categories of Restaurant KPI Metrics
Restaurant KPI metrics can be divided into different categories based on the area of business they measure. Tracking these categories helps restaurant owners understand financial performance, operational efficiency, customer satisfaction, employee productivity, and inventory management.
1. Financial KPIs
Financial KPIs help restaurants measure revenue, expenses, and overall profitability. These metrics provide insights into how efficiently the restaurant is generating and managing money.
Key Financial KPIs include:
Revenue: Total sales generated over a specific period.
Food Cost Percentage: Measures the cost of ingredients compared to sales.
Profit Margin: Shows the actual profit earned after deducting expenses.
Average Order Value (AOV): Tracks the average amount spent by customers per order.
Benefit: Helps restaurants control costs, increase profits, and improve financial planning.
2. Operational KPIs
Operational KPIs measure the efficiency of daily restaurant activities, from order processing to service delivery.
Key Operational KPIs include:
Kitchen Speed: Measures how quickly orders are prepared.
Table Turnover Rate: Tracks how efficiently tables are managed during business hours.
Order Accuracy: Measures errors in food preparation and delivery.
Order Processing Time: Tracks the time from order placement to completion.
Benefit: Helps reduce delays, improve workflow, and provide faster service.
3. Customer KPIs
Customer KPIs help restaurants understand guest satisfaction, loyalty, and overall experience.
Key Customer KPIs include:
Customer Retention Rate: Measures how many customers return.
Customer Reviews & Ratings: Tracks online reputation and feedback.
Customer Satisfaction Score: Evaluates overall dining experience.
Repeat Purchase Rate: Shows customer loyalty.
Benefit: Helps improve service quality, build customer trust, and increase repeat visits.
4. Staff KPIs
Staff KPIs focus on employee performance, productivity, and workforce management.
Key Staff KPIs include:
Labor Cost Percentage: Measures employee expenses compared to revenue.
Staff Productivity: Tracks employee efficiency during shifts.
Attendance and Shift Performance: Monitors workforce reliability.
Sales Per Employee: Measures revenue contribution by staff members.
Benefit: Helps optimize staffing, improve productivity, and reduce unnecessary labor costs.
5. Inventory KPIs
Inventory KPIs help restaurants manage ingredients efficiently and reduce unnecessary losses.
Key Inventory KPIs include:
Food Wastage Percentage: Measures the amount of food wasted.
Stock Variance: Identifies differences between expected and actual inventory levels.
Inventory Turnover Rate: Tracks how quickly stock is used.
Ingredient Cost Tracking: Monitors spending on raw materials.
Benefit: Helps reduce waste, prevent stock shortages, and maintain better inventory control.
The Core Financial KPIs
1. Food Cost Percentage
Food cost percentage is the single most important profitability metric in any restaurant. It tells you what portion of your revenue is being consumed by raw ingredients.
Formula: (Cost of Goods Sold ÷ Total Food Sales) × 100
Most full-service Indian restaurants aim for a food cost percentage between 28% and 35%, while quick-service restaurants (QSRs) and cloud kitchens often target 25–30% due to leaner menus. If your food cost is creeping past 35%, it usually points to portion inconsistency, vendor price hikes, wastage, or under-priced menu items.
2. Prime Cost
Prime cost combines your two biggest expense categories — cost of goods sold and labor cost — into a single number, because together they typically represent 55–65% of total revenue in a well-run restaurant.
Formula: COGS + Total Labor Cost
Keeping prime cost under 60% of revenue is a widely used benchmark. Anything higher, and there's very little left over for rent, utilities, marketing, and actual profit.
3. Gross Profit Margin
This shows how much revenue remains after subtracting the direct cost of producing your food and beverages, before overheads like rent and salaries are factored in.
Formula: ((Total Revenue − COGS) ÷ Total Revenue) × 100
4. Average Order Value (AOV)
AOV tells you how much, on average, each customer or table spends per visit or order — a critical number for upselling strategy and menu engineering.
Formula: Total Revenue ÷ Number of Orders
Tracking AOV separately for dine-in, takeaway, and delivery (Swiggy/Zomato) channels reveals where your upselling efforts are working and where they're falling flat.
5. Cost per Cover (Cost per Guest)
This metric measures the total cost incurred to serve one guest, factoring in food, beverage, and sometimes labor cost, helping you understand true per-customer profitability.
Operational KPIs That Drive Daily Decisions
6. Table Turnover Rate
Table turnover rate measures how many times a table is occupied by different guests within a given time period — a direct indicator of how efficiently your dine-in space is being used.
Formula: Number of Parties Served ÷ Number of Tables Available
A healthy turnover rate varies by restaurant format: fine dining might target 1–2 turns per evening, while a casual QSR could aim for 4–6 turns during peak hours. Slow turnover during peak hours directly caps your revenue potential, no matter how full the restaurant looks.
7. Order Accuracy Rate
This tracks the percentage of orders delivered correctly — right dish, right modifications, right table — without errors that trigger complaints, remakes, or refunds.
Formula: (Accurate Orders ÷ Total Orders) × 100
Order accuracy has an outsized impact on both customer retention and food cost, since every incorrect order typically means wasted ingredients and a remade dish.
8. Table Turn Time / Average Service Time
This measures how long, on average, a table takes from seating to payment — a metric that directly affects both turnover rate and customer satisfaction if it swings too far in either direction.
9. Kitchen Ticket Time
Kitchen ticket time tracks how long it takes from an order being punched in to it being marked ready — a KPI that a Kitchen Display System (KDS) tracks far more accurately than handwritten paper tickets ever could.
10. Void and Discount Rate
This tracks the percentage of orders that are voided, comped, or heavily discounted — often an early warning sign of either operational errors or, in some cases, internal fraud or billing manipulation.
Formula: (Total Value of Voids/Discounts ÷ Total Sales) × 100
Customer and Revenue KPIs
11. Customer Retention Rate
This shows what percentage of your customers return for a repeat visit within a given period — arguably the clearest signal of whether your food, service, and value proposition are actually working.
Formula: ((Customers at End of Period − New Customers Acquired) ÷ Customers at Start of Period) × 100
Acquiring a new customer typically costs five to seven times more than retaining an existing one, which makes this one of the highest-leverage KPIs on this list.
12. Revenue per Available Seat Hour (RevPASH)
RevPASH combines both pricing and utilization into a single metric, showing how effectively you're monetizing your seating capacity over time.
Formula: Total Revenue ÷ (Number of Seats × Operating Hours)
13. Online Ordering and Aggregator Share
With Swiggy and Zomato often contributing 30–50% of total revenue for many Indian restaurants, tracking the revenue split between dine-in, direct online orders, and aggregator platforms — along with the commission cost of each channel — is essential for understanding true channel profitability.
14. Customer Satisfaction Score (CSAT) / Net Promoter Score (NPS)
These metrics, gathered through post-visit feedback, reviews, and ratings on Zomato, Google, and Swiggy, quantify how customers actually feel about their experience, beyond what sales numbers alone can show.
Staffing and Labor KPIs
15. Labor Cost Percentage
Formula: (Total Labor Cost ÷ Total Revenue) × 100
Most Indian restaurants target labor cost between 20% and 30% of revenue, though this varies significantly by format and whether you run in-house delivery staff.
16. Employee Turnover Rate
High staff turnover is one of the most underestimated cost centers in Indian restaurants — every exit means recruitment cost, training time, and a temporary dip in service quality and consistency.
17. Sales per Labor Hour
This shows how much revenue each hour of staff work generates, helping you right-size your scheduling against actual demand patterns rather than habit or guesswork.
Which KPI Matters Most for Different Restaurant Types?
Every restaurant operates differently, so the most important KPIs depend on the business model, customer expectations, and operational goals. While some restaurants focus on speed and volume, others prioritize customer experience, profitability, or inventory control.
Understanding the right KPIs helps restaurants improve performance and make better strategic decisions.
1. Quick Service Restaurants (QSR)
Quick Service Restaurants focus on serving more customers in less time while maintaining consistency and efficiency.
Important KPIs:
Order Speed: Measures how quickly customers receive their orders.
Average Order Value (AOV): Tracks the average spending per customer.
Ticket Time: Measures the time taken from order placement to completion.
Customer Throughput: Tracks the number of customers served during a period.
Why it matters:
For QSR businesses, faster service and higher order volumes directly impact revenue and customer satisfaction.
2. Fine Dining Restaurants
Fine dining focuses on premium experiences, personalized service, and customer loyalty rather than just order volume.
Important KPIs:
RevPASH (Revenue Per Available Seat Hour): Measures how efficiently restaurant seating generates revenue.
Customer Satisfaction Score: Tracks guest experience and service quality.
Repeat Customers: Measures customer loyalty and retention.
Average Spend Per Guest: Tracks customer purchasing behavior.
Why it matters:
Fine dining restaurants need to balance exceptional service with profitability by creating memorable customer experiences.
3. Cloud Kitchens
Cloud kitchens depend heavily on online orders and delivery efficiency. Since there is no dine-in experience, operational performance becomes critical.
Important KPIs:
Delivery Time: Measures how quickly orders reach customers.
Aggregator Sales Performance: Tracks revenue from platforms like food delivery marketplaces.
Food Cost Percentage: Helps control ingredient expenses.
Order Accuracy: Reduces customer complaints and refunds.
Why it matters:
Efficient delivery, cost control, and strong online performance are key drivers of cloud kitchen success.
4. Bakeries
Bakeries deal with highly perishable products, making inventory management and sales forecasting essential.
Important KPIs:
Inventory Turnover Rate: Measures how quickly products and ingredients are sold.
Food Wastage Percentage: Tracks unsold or expired products.
Daily Sales: Monitors revenue performance day-by-day.
Product Demand Analysis: Identifies best-selling bakery items.
Why it matters:
Effective inventory control helps bakeries reduce wastage and maximize profitability.
5. Cafés
Cafés focus on customer experience, repeat visits, and maximizing revenue from each customer.
Important KPIs:
Average Order Value (AOV): Measures customer spending per visit.
Repeat Customers: Tracks customer loyalty and retention.
Table Turnover Rate: Measures seating efficiency.
Peak Hour Sales: Helps optimize staffing and promotions.
Why it matters:
Cafés can improve revenue by increasing customer frequency and optimizing seating utilization.
6. Multi-Outlet Restaurant Chains
Managing multiple outlets requires centralized monitoring and performance comparison across locations.
Important KPIs:
Outlet Performance Comparison: Compares sales, profits, and efficiency between branches.
Labor Cost: Tracks workforce expenses across outlets.
Inventory Management: Monitors stock usage and wastage at each location.
Profitability Analysis: Measures the financial performance of every outlet.
Why it matters:
Multi-outlet businesses need consistent operations, cost control, and real-time visibility to scale successfully.
KPI Benchmark Snapshot for Indian Restaurants
KPI | Healthy Benchmark Range |
Food Cost % | 28–35% (25–30% for QSR/cloud kitchen) |
Prime Cost | Below 60% of revenue |
Labor Cost % | 20–30% of revenue |
Table Turnover (peak hours) | 1–2 (fine dine) to 4–6 (QSR) |
Order Accuracy Rate | 97%+ |
Void/Discount Rate | Below 2–3% |
Customer Retention Rate | 30%+ (varies by format) |
Note: Benchmarks vary by city, cuisine, and format — use them as a directional guide, not an absolute rule.
Common Mistakes Restaurant Owners Make While Tracking KPIs
Many restaurant owners track KPIs incorrectly, which can lead to poor decisions and reduced profitability. Avoiding these common mistakes helps improve operational control and business growth.
1. Focusing Only on Sales
High sales do not always mean high profits. Owners should also track food cost, labor cost, and expenses.
2. Ignoring Labor Costs
Not monitoring staff productivity and labor expenses can increase operational costs.
3. Tracking Monthly Instead of Daily
Monthly reports can delay problem-solving. Daily KPI tracking helps identify issues quickly.
4. Not Comparing Outlets
Multi-outlet businesses should compare branch performance to improve efficiency.
5. Ignoring Online Delivery Data
Delivery sales, ratings, and platform performance are important for modern restaurants.
6. Using Manual Calculations
Spreadsheets and manual tracking increase errors and waste time.
7. Not Tracking Recipe Costing
Without recipe costing, restaurants cannot accurately calculate dish profitability.
8. No KPI Dashboard
A centralized dashboard provides real-time insights and helps make faster decisions.
Effective KPI tracking requires accurate data, automation, and regular monitoring to improve restaurant performance.
Why Manual KPI Tracking Fails Most Restaurants
Many restaurant owners in India still try to calculate these numbers manually — pulling data from paper KOTs, separate billing software, and end-of-day cash counts, then reconciling it all in Excel at month-end. The problems with this approach are consistent and predictable:
Delayed insight: By the time a food cost spike shows up in a monthly report, weeks of margin have already been lost.
Disconnected data: Sales data, inventory data, and staff data often live in separate systems that don't talk to each other.
Human error: Manual entry and calculation introduce mistakes that compound over time.
No real-time visibility: Owners managing multiple outlets can't see what's happening across locations without physically visiting or calling each manager.
This is precisely the gap that a modern, integrated restaurant management system is built to close.
How Zilicius Turns KPI Tracking Into a Real-Time Dashboard
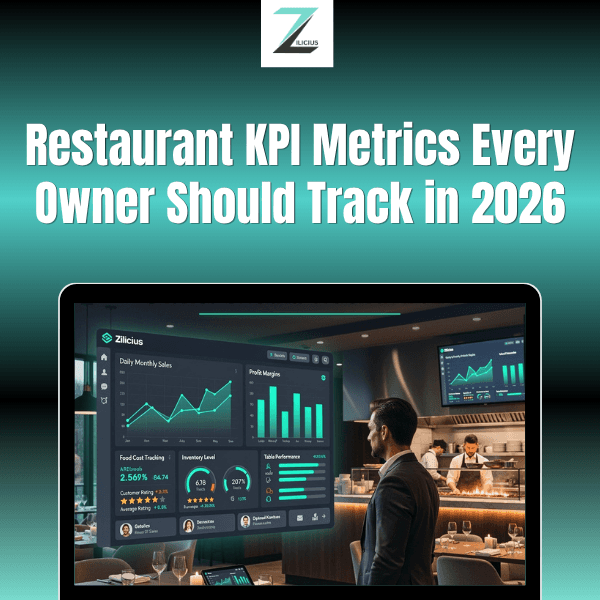
Zilicius is built as a unified restaurant management and POS platform specifically designed for the operational realities of Indian restaurants, cloud kitchens, and multi-outlet chains. Instead of stitching together billing software, inventory spreadsheets, and manual reports, Zilicius consolidates the data needed for every KPI above into one live dashboard.
Automated food cost tracking: Zilicius links recipe-level costing with real-time inventory consumption, so food cost percentage updates automatically as sales happen — not just at month-end.
Table and order analytics: Built-in reporting tracks table turnover rate, average service time, and order accuracy without any manual logging.
Kitchen Display System (KDS) integration: Ticket times are captured automatically, replacing error-prone paper KOTs and giving kitchen managers a live view of bottlenecks.
Multi-location dashboards: Owners running multiple outlets can compare prime cost, labor cost percentage, and revenue KPIs across branches from a single screen.
Aggregator integration: Zilicius syncs directly with Swiggy and Zomato, consolidating aggregator and dine-in revenue into one reporting view so channel profitability is finally visible in one place.
Staff and labor reporting: Attendance, shift scheduling, and sales-per-labor-hour data feed directly into labor cost tracking.
GST-ready billing: All revenue and tax reporting stays compliant with Indian GST requirements, with UPI and card payment reconciliation built in.
For an Indian restaurant owner, this means the difference between discovering a margin problem two months too late and catching it the same week it starts — while everything stays compliant with GST and local billing norms from day one.
Getting Started: Which KPIs to Track First
If you're just starting to build a KPI tracking habit, don't try to monitor all seventeen metrics from week one. Start with these four, since they have the highest impact on profitability and are the fastest to act on:
Food cost percentage — because it directly protects your margin
Table turnover rate — because it caps your revenue ceiling during peak hours
Labor cost percentage — because it's your second-largest controllable expense
Customer retention rate — because it's cheaper to keep a customer than find a new one
Once these become second nature, expand into the operational and channel-level KPIs to get a fuller picture of restaurant health.
Final Thoughts
The restaurants that consistently grow in India's competitive food service landscape aren't guessing their way to profitability — they're tracking food cost, labor cost, table turnover, and customer retention with the same discipline they bring to their menu. The right restaurant KPI metrics turn vague instincts like "we had a good weekend" into precise, actionable insight like "food cost crept up 3% because of a vendor price change on paneer."
The tools you use to track these numbers matter just as much as knowing which numbers to track. A platform like Zilicius removes the manual reporting burden entirely, giving owners and managers a real-time, accurate view of exactly how their restaurant is performing — so decisions can be made this week, not next month.
Frequently Asked Questions
Q1. What are the most important KPIs for a restaurant to track?
The most critical restaurant KPIs are food cost percentage, prime cost, labor cost percentage, table turnover rate, and customer retention rate, as these have the biggest direct impact on profitability and long-term growth.
Q2. What is a good food cost percentage for restaurants in India?
Most full-service Indian restaurants should aim for a food cost percentage between 28% and 35%, while QSRs and cloud kitchens typically target a leaner 25–30% due to more standardized menus.
Q3. How is table turnover rate calculated?
Table turnover rate is calculated by dividing the number of parties served by the number of available tables over a specific time period, giving you a clear picture of how efficiently your dine-in seating is being used.
Q4. How can restaurant management software help track KPIs?
Restaurant management software like Zilicius automatically pulls data from billing, inventory, kitchen operations, and aggregator platforms into one dashboard, eliminating manual calculation and giving owners real-time visibility instead of delayed monthly reports.
Q5. What is prime cost in restaurant accounting?
Prime cost is the combined total of your cost of goods sold and labor cost, and it's considered one of the most important profitability indicators because these two expenses together typically make up 55–65% of a restaurant's total revenue.
Q6. How often should restaurant owners review their KPIs?
Financial KPIs like food cost and labor cost percentage are best reviewed weekly, while operational KPIs like table turnover and kitchen ticket time are most useful when monitored daily or even in real time through a POS dashboard.
Also Read
How to Handle Peak-Hour Restaurant Rush Efficiently: A Complete Guide for Restaurant Owners